Showing posts with label infra. Show all posts

Wednesday, August 5, 2026

Honeypot Notes Part 3 - endpoint data

Intro

(No AI was involved in writing, research, etc...)

See part 1 and 2 here: 

https://www.boredhackerblog.info/2026/08/honeypot-notes-part-1-deploymentdesign.html

https://www.boredhackerblog.info/2026/08/honeypot-notes-part-2-network-data.html  


Just like collecting pcap data, logs provide us with info such as payloads and how an attack was done/what the attacker is trying to do. Logs is just another source. Personally, I feel that the logs are a better/higher fidelity indicators of successful exploitation. 

You could always use an EDR agent but I'm going with the assumption that there is no budget and focusing on opensource/free stuff. 


Log types and why collect them:

We want endpoint logs such as process execution, file creation/deletion, network connections (contain process responsible), authentication logs, and various other system logs.

There are also specific app logs that may be specific to your honeypot or how you run the honeypot. This includes logs for web server such as apache/nginx or logs your webapp writes (audit/activity logs). 

If your app runs inside of a docker container, you'll want to capture container logs too. 

Technically these aren't logs but you can try to collect crash dumps or core dumps too.

Endpoint logs can help with identifying post-exploitation activity and also help you write signatures for detecting similar behavior in your environment. 

Specific app logs are also useful for identifying post-exploitation behavior but more focused on what the attacker does inside the app itself (like new user added). 


Log collection, storage, and processing:

Log collection tooling:

Before you start collecting logs, ensure that you have correct logging enabled. On Windows for example, you may have to enable more logging to capture process execution data. On Linux, you may have to install more tooling to capture the data that you want.

You can add tools such as sysmon, sysmon for linux, or auditd to get more data as well.

For collecting logs, there are various tools already out there. Elastic Beats, Splunk UF, Vector, fluentbit, fluentd, and more.  


Storage:

There are a couple of things you can do with logs besides letting them just sit on the host itself:

- write them into a mounted remote share - attackers can go and delete these files though

- Send logs to S3. These tools support S3 as a sink. 

- Send logs directly to SIEM/log centralization service. 

You always have the option to send logs to multiple places as well.

If you end up using something like Wazuh or Elastic agent, you can send logs directly to SIEM too.


Be sure to configure some filtering so you're not constantly capturing events for logging tool making connection or writing to disk. You'll probably need to update network traffic capture filter to avoid capturing traffic for log uploads.


If you are monitoring something that gets compromised a lot, you probably want to revert the honeypot VM and I'm not sure if that breaks logging or not personally. Something that you may want to test.  


You'd also have logs you'd need to collect from whatever network traffic analysis tools generated. 


Processing:

Processing logs depends on how you collected them. If they're in S3, you can always use collection tools to read files from S3. You can also trigger scripts after file is uploaded to S3 to do processing.

If you have file share w/ logs, you can use log collection tool to read them again and send them to whatever SIEM you'd like.

You will at some point need to parse the logs. This can be done within log collection tool or SIEM where you're sending the logs to, if it supports it.


For centralizing logs, I recommend looking at elasticsearch, opensearch, and splunk free.

I do have some collectors listed here: https://github.com/stars/BoredHackerBlog/lists/log-collectors

Also some software to store logs into for searching: https://github.com/stars/BoredHackerBlog/lists/logging 


Once you have your logs in one place where you can search them, make dashboards, or generate alerts, you'll probably to know when something bad happens. 


Signs of exploitation:

Looking for signs of exploitation in logs is pretty much same as looking for attacks in normal environments. There are a bunch of sigma rules or premade detections or dashboards that can be used. 

For more focused approach, especially if the vuln isn't known, you can look for your honeypot software or process responsible for running honeypot software (apache or something for webapp) spawning new child processes, writing files, or making odd network connections.

For webapps specifically, signs of new file being written in web server directory could be interesting (like webshell). 

Additionally, monitoring app audit logs could be helpful. For example, if you have a VPN with potential auth bypass vuln, successful exploitation may look like logs showing new VPN client or something.

I think depending on your honeypot software, you can probably determine what exactly needs to be monitored to see if it got popped.


As mentioned in the first post, none of this is magic. It's same as managing normal endpoints but just collecting a bit more data and hoping there is an actual compromise (if you want something interesting to research).

Honeypot Notes Part 2 - network data

Intro

(No AI was involved in writing, research, etc...)

Read part 1 here:

https://www.boredhackerblog.info/2026/08/honeypot-notes-part-1-deploymentdesign.html 


The reason we want pcap data is because we want to know what the attacker intends to do/execute and how. In some cases, logs don't have enough information. 

For example, if you have a patched/latest version IP/IOT camera you're monitoring and it finally gets compromised, your logs may not have enough data such as body for POST request or actual packet that caused it to execute malicious commands. Having full pcap data lets you go back and figure out what the input was that lead to the compromise.

The other reason to collect pcap data is because we want to know more about outbound traffic from our honeypot after exploitation. Sometimes the payload may be obfuscated and when executed leads the honeypot to download secondary payload and we want to know about that. (think of log4j vuln exploitation flow)

I'm going with assumption that you don't have money to buy commercial remote traffic capture sensors. I'm just using free/open source things. 


Traffic processing tools:

Here are some tools that can be helpful for processing traffic data:

Suricata/Snort - these are network intrusion detection systems. They can parse certain protocols and also support detection rules so you can look for specific payloads or type of traffic. For example, if you expect the attacker to send payload to a certain URI, you can write a custom detection to get alert on it. These can also be useful for looking at outbound traffic. 

Zeek - Zeek is also another intrusion detection software. It parses protocols as well. Zeek has a scripting language that actually lets you write scripts that run on captured traffic. This can be useful if you want to extract specific payload data. It has ability to extract files from some protocols too, which I see people using all the time.

Python Scapy - Python Scapy library lets you process network traffic data and extract and further process things through python scripting. Here's an example of me doing that: https://www.boredhackerblog.info/2016/02/extracting-images-from-crestron.html 

Arkime - last time I used this, it was called Moloch. Arkime lets you capture packets and analyze all the data through webui.

There are probably other tools I'm missing.  


Capturing data:

How do you capture data?

I used to run Suricata on the honeypot or sensor itself. I didn't like that because I'm capturing and processing data in the same place.


For my recent projects, I just kept it simple. I capture data using tcpdump. I'd like to keep raw packet data so I can even go process it later with various tools if needed.

One option I've thought about is using a remote tzsp capture tool and forwarding traffic to another tcpdump instance but it gets needlessly complicated and there is more chance of failure. 

Where exactly do you collect data from?


This would depend on your setup and it would also impact how you store and process data. There are benefits and downsides too. (storage and processing is discussed later)

You could do tcpdump on VPS, internal traffic forwarder, honeypot, or vlan port (from proxmox). 

Doing tcpdump on VPS and internal traffic forwarder gets you incoming data but you don't get outbound traffic. 

If you capture data on honeypot itself, getting that data out for processing may be a bit difficult but you can see outbound connection attempts.

Collecting data through proxmox by monitoring the specific interface could be an option too.

I have not tried this but you could make traffic forwarder machine a DHCP/DNS/gateway but drop all the honeypot traffic, then still capture outbound traffic and incoming traffic on the traffic forwarder itself. 

Personally, for the project I'm working on, i just put tcpdump on honeypot itself because it was simple. 


Storage, capture filters, and processing:

Chances are, you want to run honeypot for long term which means you'll have a ton of pcap data. 

VPS likely doesn't have enough disk space to store pcaps and also now you have to reach out to VPS to get the pcaps for processing.   

Couple of ideas I've had for storage are: 

- Mount a file share to VPS, traffic forwarder, or honeypot

- Mount a folder to VM (through your VM manager) running traffic forwarder or honeypot.

- Put pcap files on s3/remote machine based on how many traffic is captured or how much time goes by


Mounting file share requires you to create a file share, users, manage permissions, etc. Once you do that, you gotta go to VPS, traffic forwarder, or honeypot and mount the remote share. Managing gets annoying and now you risk threat actor accessing the share and deleting captured data. 

Proxmox supports mounting a folder to the VM which is great but attacker still can go and delete the pcap files. 

tcpdump has a feature that lets you capture and write new files based on how much time has passed or how much data you have captured. This is great because you can capture pcap files, upload them to an s3 bucket(even self hosted), and delete the files from disk. 

I found two posts/projects that discuss how to do this:

https://davecturner.github.io/2020/12/12/rolling-tcpdump.html

https://github.com/FastNetMon/cloud_pcap

I really like the idea of just uploading pcaps to s3 bucket where you can do better access control as well.


Capture filters:

Capture filters are very important. If you're writing pcap data to a remote file share or uploading pcaps to s3, you don't want to capture that upload/write activity back into a new pcap or else you'll keep infinitely increasing your pcap size. I've accidentally done this before. :-( 

You also want to think about what you want to capture. If it's just a simple low interaction honeypot you deployed, you may want to just capture data on one specific port. If your honeypot is expected to get fully compromised, you may want to capture all the traffic and maybe exclude storage/upload traffic. 


Processing traffic:

If you're writing files to disk, you can use inotify to trigger scripts when a new file has been written, alternatively, suricata has a directory monitoring feature as well.

S3 or self-hosted S3 alternatives should have a configuration for triggering webhooks for when a new file is uploaded. These options can be used to trigger scripts as well. 

Suricata and zeek both have ways to read pcap files:

https://docs.suricata.io/en/latest/capture-hardware/pcap-file.html

https://docs.zeek.org/en/current/quickstart.html#running-zeek

https://isc.sans.edu/diary/29530


You always have the option of running a custom python script with scapy to extract whatever you need. 


Your processing will produce logs and may produce binary files too. Logs will be discussed later.  


Encrypted traffic:

I don't have a solution to deal with encrypted traffic. I don't really know much about cryptography to be honest. 

You may have honeypot services that may use TLS/SSL encryption and you still want payload data.

First thing to check is, if you can upload/use your own cert. If that's possible, you can analyze unencrypted traffic later.

You can also do weird things like use a reverse proxy which allows HTTP traffic in but sends it to HTTPS service so when an attacker attacks, you can capture HTTP traffic. 

You may also be able to do some magic via socat. 


Signs of exploitation:

Finally, the interesting part. How do we know there was exploitation so we can go look at payloads or attack method?

If your honeypot has a known vuln, you can just focus on how that vuln is exploited and where exploit code and payload will be.


I think it would be cool to find in-the-wild exploitation of certain vuln before public POC exists.

If your honeypot software does not have a known vuln or public POC, there are several things you can do, at least for webapps.

First thing you can do is look at traffic to specific URI or paths that a normal scanner or bot wouldn't touch but an attacker might.

You can review parsed data or set up a suricata rule that looks for traffic to specific URI (mysite.com/plugins/very_specific_plugin/upload.php) or partial URI (mysite.com/plugins/*). If you do see traffic that matches, you can review payload and see what the attacker attempted to do.

Additionally, you can just rely on free suricata rules too to find things. I believe there is also a threat hunting rules out there that you can use with suricata.


Outbound traffic:

Regardless of if you have a webapp or some other honeypot service, outbound traffic can be helpful with detecting successful exploitation.  

The reason why you may want to capture outbound traffic/attempts is because that may show you signs of successful exploitation.

You can exclude known outbound traffic and look for unknown outbound traffic to maybe like a weird domain or IP.

Additionally, you can look for traffic to OAST sites. In some cases, the attacker may do exploitation and check to see if certain code ran and connected to one of the OAST domains or URL.

See this rule: https://detection.fyi/sigmahq/sigma/network/dns/net_dns_external_service_interaction_domains/ 

You can also rely on free suricata rules as mentioned earlier but focus on outbound traffic. 


This isn't very different from normal traffic monitoring except you have to figure out where to collect the data, how to store it, and how to process it. After processing, you just have to look for signs of your specific app being targeted and successful exploitation or at least attempts.


Next post looks at collecting and processing logs. 

Part 3:  

https://www.boredhackerblog.info/2026/08/honeypot-notes-part-3-endpoint-data.html 

Honeypot Notes Part 1 - deployment/design

Intro

(No AI was involved in writing, research, etc...)

Note: this blog is titled "Honeypot Notes" because I don't professionally deal with honeypots anymore and I haven't really followed what other people do. Since this isn't academic/professional writing, I haven't done lit review so I don't know what's going on out there. I'm just writing this up because maybe someone will find it useful. None of this should be new to people who professionally do this.


I first dealt with managing/deploying honeypots in 2015. It was my first infosec job.

I'm not sure if this was my idea, my managers idea, or an idea we got from CircleCityCon (rip) or BSidesIndy (rip) presentations. Either way, the company gave me money to do this.

Actually, here's what I found in my old slides (these were made after I left my job):


Here's how I went about setting things up:

We bought VPS (virtual private server) machines from various sites for running honeypots. VPS companies used to offer LXC/LXD containers or KVM VMs.

To pay for VPS servers, we used prepaid cards and bitcoins. 


Regarding software: 

We used MHN (Modern Honey Net). MHN let you deploy various types of honeypots and pulled the relevant data back from the honeypots to the main MHN server. MHN basically would run scripts to install whatever type of honeypot you wanted. 

If I recall correctly, MHN stored data into mongodb and we pulled that data and put it into Elasticsearch. 

The malicious IPs were used to make a blocklists for customers. Other data collected with honeypots was used for research internally. 


Why?

Honeypots can serve several functions. You can see who's attack things and what type of attacks they're doing. You might be able to capture malware samples or payloads to analyze. You can create blocklists based on behavior from various IPs.

Based on data collected by various people who run honeypots and share data, you could determine if you were hit with a targeted or unique attack.

Finally, honeypots may be useful for capturing in-the-wild attacks for new vulnerabilities or unknown vulns. 

When I was running honeypots, I did see Elasticsearch (which our company used internally & for customer data) being attacked in the wild (screenshot from an email):


My Linux botnet research project was also inspired by a malware sample I got from a honeypot as well.

https://www.boredhackerblog.info/2017/05/linux-botnet-malware-analysis-part-1.html 


I'm sure Greynoise also has blog posts on what their customers do with their data.

I'd also recommend looking at Intrusion Detection Honeypots: Detection through Deception by Chris Sanders.


In this series, I'm focusing on collecting payloads/attack data for vulnerable software and for software that does not currently have public vulns. I'm discussing some set up ideas and things I'm doing or have done in the past. 

I do recommend quickly scrolling over this post: https://www.boredhackerblog.info/2022/07/building-honeypot-network-with-inetsim.html  


Honeypot/sensor placement:

Placement of your honeypot depends on your goals and who you're trying to attract.

Some customers I've worked with in the past have had thinkst canary sensors placed inside their network. Some of them have put honeypot/deception machines on public IP owned by their org. 

Some threat actors may think twice before using a shiny new exploit on some random VPS vs IP owned by a company.

In this blog, I'm just focusing on internet facing sensors that are deployed on VPS/datacenter-owned IPs. 


You should also think about how many services your sensor will run. For example, are you going to run one VPS and put 3-5 different vulnerable services on it or are you going to run separate VPS for each vulnerable service you're running? Depending on what you do, you might catch different things.

Thinking from an attackers point of view, if I search Shodan for a vulnerable service and I see one IP with multiple vulnerable services, I'd probably not touch that. If I'm a bot/script that constantly scans the internet and tries to exploit everything, I wouldn't care if one IP is hosting multiple vulnerable services.

I'm focusing on hosting one service/profile on one VPS. 


Honeypot types & software:

There are many different articles out there regarding different types of honeypots such as low interaction, high interaction, etc. I would recommend reviewing those. 

Low interaction might be something very static that looks like the service you're pretending to be but isn't. You may catch some initial payloads with this. High interaction might be something that is actually vulnerable that someone could do a full attack on. 

You can also simulate services that someone could do a partial attack on. I think there are SMB and SSH honeypots like that out there that pretend to be vulnerable SMB server or SSH to catch payloads and/or commands.


Here are some ways you can make something low interaction, especially if you don't have the original software (licensing/access issues):

- Use wget to clone an already public facing appliance. I've done this before for a router I didn't own.

- Use Medusa (https://github.com/evilsocket/medusa) to clone existing Shodan service. I haven't used this personally.  

- Manually create simulation/service that looks like the original service. This could be like a service that's TCP socket connection-based that people connect to via telnet for example.

- Check Github to see if someone has already made a honeypot for the service.


You can modify your setup based on what you may find in Nuclei templates. Nuclei template may exist for service version discovery where it gets a specific URI/page to find a vulnerable version. Additionally, if you're setting up something to catch payloads, you can check Nuclei template to see which specific path is targeted and what's expected back from the server. 


There are ways to acquire the software you're trying to make a honeypot for as well. Obviously, you can try to find a Trial version from the vendor first.

You may also be able to check/search Github to see if you can find any repos with direct links or setup scripts that download the software. Github may also have a copy of the software itself because someone uploaded it to a public repo...

Finally, there is DockerHub as well. You might be able to search for premade container for the software you're interested in. You can then extract the software or just use the container if it works.


However you deploy your honeypot, do check Shodan, Censys, etc to see what it looks like. It may take a while before these services scan and index your honeypot.


Management & architecture:

If you deploy multiple VPS servers, you'll obviously have to manage them and make sure they're healthy. 

Check out DevOps for the Desperate from NoStarch books. It pretty much covers doing management better than I ever could here. 

Management of VPS isn't anything special. It's like managing traditional infrastructure. There may be some opsec considerations depending on how far you expect an attacker to get and your architecture. 

Depending on what VPS service provider you use, you might be able to do new VPS deployments using Terraform/OpenTofu, Vagrant, or just scripts. 

For management, you can simply use SSH alone or Vagrant as well. 

Essentially, once you have VPS up and running, you'll want the ability to remotely deploy scripts, updates, install software, and etc on all VPS or group of them. Vagrant allows you to do this easily.

You may also want to ensure that these machines are up and running all the time. You can use uptime monitoring tools such as Uptime Kuma or other paid solutions. These solutions can reach the sensor and make sure it responds. You may also want to do this in reverse. You can use a service like Healthchecks.io to have these machines send web request so you know there isn't a connectivity issue. You can avoid using these tools and just rely on incoming logs too.

You can also do cpu, memory, disk monitoring by installing an agent & logging or using something like Beszel. 


For managing honeypot software, you could utilize something like github, github actions, and containers. 

For example, if you have fake ssh service and you want to update version info, you can edit a file in github, have github actions build a new container, then you can use vagrant to deploy it or automatically deploy it.


Architecture:

MHN used to download and run the actual honeypot software on the VPS sensor itself. 

You too can run your honeypot software on VPS sensor itself. You can install the software on the VM itself or run it inside of a docker container. Depending on your software and how far you expect the attacker to get, you may need to implement a few more things, such as hardening and firewalling. 


Depending on your VPS specs (cpu, ram, disk) and the honeypot software you want to run, you may run into issues. Some VPS can't run certain things due to CPU being slow or RAM not being enough.

There are ways around this! You can do traffic forwarding! 

Essentially, the VPS doesn't run much. It just takes traffic that comes in and forwards it somewhere else, like the machine where your honeypot software is running. 

Below, I'll discuss several designs I've tried and other options as well.

I do recommend looking at this: https://github.com/opsdisk/the_cyber_plumbers_handbook 


First, there are several options for traffic forwarding. I guess you can use iptables but personally, I hate messing with it.

I've used rinetd, socat, and Caddy reverse proxy. Reverse proxy is for specifically web traffic. rinetd and socat work for various protocols.

You could just forward traffic from VPS to your honeypot machine directly but it might be better to do it in a virtual network. You can make a virtual network by using openvpn, wireguard or use easier tools like zerotier, tailscale, etc.


In the blog post I mentioned earlier, I did the following:

VPS, my honeypot software (inetsim), and log server are on the same network using Zerotier.

VPS run suricata for analyzing network traffic and ship data to logging server.

Rinetd forwards incoming traffic to one single inetsim server. (keep fingerprinting in mind, if you do this. Depending on what you're running, someone can figure out that all these VPS just point to the same thing)


This is another way:

VPS and rinet traffic forwarder box(proxmox) are connected via Zerotier

VPS runs rinetd which forwards traffic to rinetd box running in proxmox which forwards traffic to honeypot machine on isolated network.

honeypot machine and rinetd running on proxmox send the logs to logging server.

The benefit is, there is one place where i can run suricata and collect all the traffic. This is also somewhat easy to manage. You can just keep editing rinetd config and forward traffic where ever you need.

Problem with this is, if wordpress gets popped, the attacker can't get out to the internet but can start attacking other machines. You may have to do some hardening and firewall config to prevent this. 


You can also do something like this:

Each VPS runs rinetd to forward traffic.

Each VPS and proxmox rinetd forwarder is on a different virtual network

Each honeypot machine is on a separate network.

honeypots send logs to rinet machine on promxox and it forwards logs to log storage server.

Obviously this gets very complicated and annoying to manage.  


At this point, I wanna say check out Greynoise Swarm: https://www.greynoise.io/project-swarm

I've been using Greynoise Swarm and I plan to use it more in the future. They essentially take care of all of this automatically. It's less risky. You deploy VPS and their sensor on it and use the webui to attach it to a profile/honeypot. At the time of writing, they do support you uploading a custom honeypot OVA or you can use raspberry pi and attach a physical device (vuln camera, router, etc) you have.


Hardening & Firewall: 

If you're using honeypot software that's vulnerable or you expect the software to get popped, you'll need to worry about several things. 

You don't want to be part of an attack. You don't want the threat actor to abuse your honeypot to DDoS people or use it as a proxy to brute force & login to corporate VPS servers and emails. You also don't want the attacker to do lateral movement and potentially compromise other things in your env.

You can maybe use hardened linux distros/images and run things in a container. Obviously, this doesn't prevent everything. We're just reducing the attack surface/making it harder for the attacker to do bad things. 

You can apply firewall rules to your honeypot to prevent outbound traffic but still allow inbound traffic to the vulnerable app. Just be aware that the attacker may pop a shell, escalate privs, and disable firewall rules. You also want to reduce attack surface by applying firewall rules on your traffic forwarder (like don't allow attacker to ssh into your machine thats doing traffic forwarding).

ufw example:

ufw enable
ufw default deny outgoing
ufw default deny incoming
ufw allow in ssh (add additional rules for your honeypot service) 

Proxmox and/or opnsense firewall may allow additional firewalling that's outside of the honeypot OS itself.

If you do have a webapp honeypot, there is another issue. The attacker technically could start abusing that to host phishing lures, credential phishing, or payloads. You may want to think about reverting VMs or docker containers once in a while.


At the end of the day, none of this is magic and it's just like how you'd manage other PCs in your environment, except you want these machines to get compromised and wanna collect the data.


Next post is about gathering network data because we want payloads!

Part 2: 

https://www.boredhackerblog.info/2026/08/honeypot-notes-part-2-network-data.html 

Saturday, October 7, 2023

Installing Whonix Gateway on Proxmox for threat & malware research

Intro

Whonix is a tool for routing traffic through Tor.  Whonix VM's come as Desktop/with UI or CLI. They provide two types of VM's, one is gateway and one is workstation. Whonix gateway can be used to route traffic through tor when you attach other VM's to it. 

In this post, I'm just setting up Whonix Gateway CLI so I can route my VMs through tor while I'm reaching malware or threats. 

This set up may not always be ideal for research as some C2's, phishing kits, and OSINT research sites may block tor exit nodes.


Warning: This method isn't officially supported by Whonix and I can't guarantee this is 100% safe and won't leak anything or won't allow an attacker to escape the whonix network or fingerprint you. Do your threat modeling and risk assessment for what you're planning to research or allow to execute in VM's. Follow official Whonix guidelines if you don't know what you're doing or don't feel comfortable doing this.


Proxmox Network Preparation

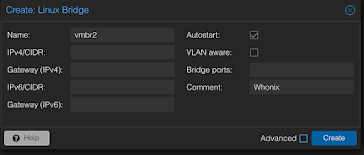
We need to create a new Linux Bridge/virtual network for Whonix so VM's can communicate with Whonix Gateway.

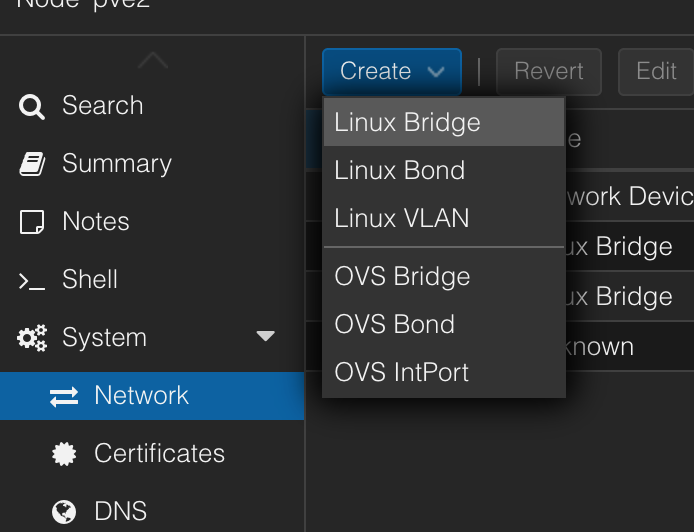
In proxmox host network settings, add a new Linux Bridge


Click "Apply Configuration" at the top to finish creating the bridge.

fyi: you may see vmbr1 if you don't have another bridge set up already.


Creating a VM

We need to create a VM to run to run Whonix Gateway in. We'll create the VM first then import the Whonix Gateway VMDK into it.

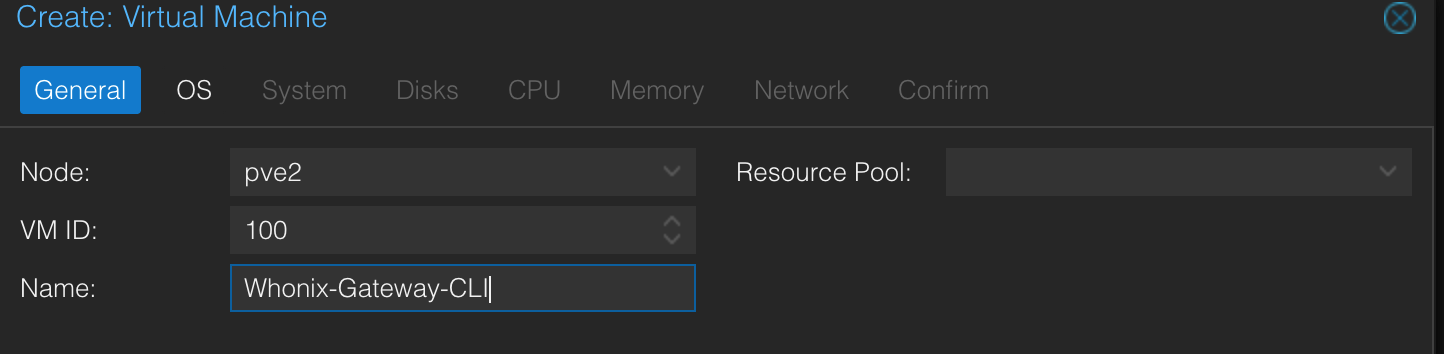
Pick a name

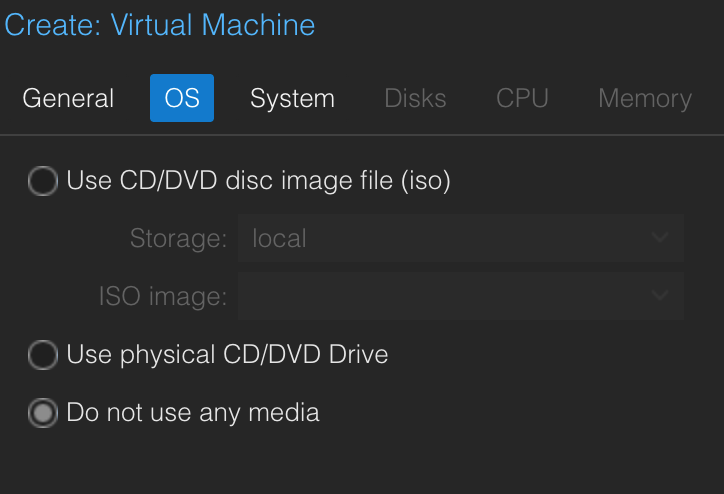
Click Do not use any media
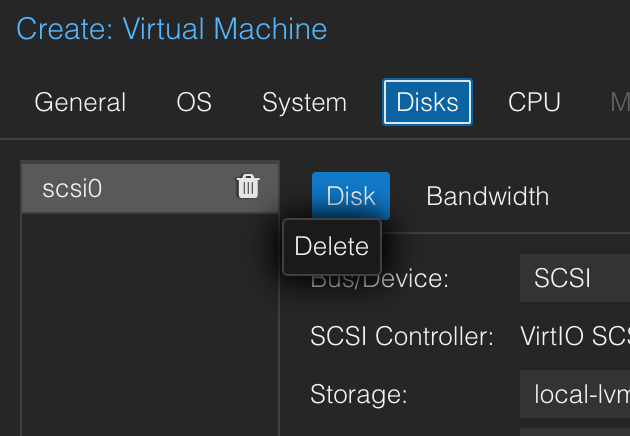
Delete the disk, we'll import a disk later

CPU & Memory can be left at default values, however, I'm lowering my memory to 1024.
Network can be left as default vmbr0. We'll add 2nd interface later.

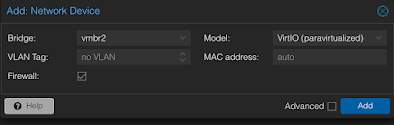
Once the VM is created, go to VM Hardware and add Network Device.

Pick and add Whonix bridge

That's all.

Loading the Whonix Gateway disk

Download Whonix CLI OVA file from here: https://www.whonix.org/wiki/VirtualBox#CLI

SCP the file to Proxmox.

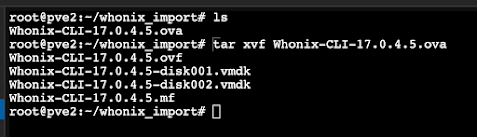
Use tar to extract the OVA file, which will give you VMDK files.


Use qm import command to import the disk to your VM

The whonix-gateway-cli VM I created earlier has the id of 100. My storage is local-lvm (it's default proxmox storage). 


Once the Importing is done and you get the message of successful import, run qm rescan.

Feel free to remove the extracted files and ova file.


Modifying the Whonix Gateway VM again

Now we need to enable the disk and change our boot settings.

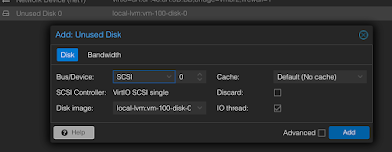
Go to Whonix-gateway-cli VM and Hardware tab and double click on "Unused disk 0" then click Add


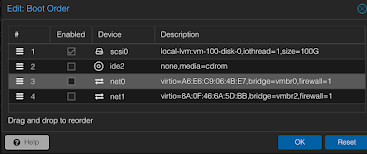
Go to Options, double-click Boot Order and modify it to boot from scisi0/the disk we just loaded.


Configuring networking inside whonix-gateway-cli VM

Make sure to remember the MAC addresses for net0 and net1 listed in hardware tab.

Essentially, we want to make sure that net1/vmbr2/whonix network has 10.152.152.10 IP.

net0/vmbr0/normal network needs to be configured w/ static IP.

Start the VM and go to the console.

Login with user/changeme then go through all the set up steps.

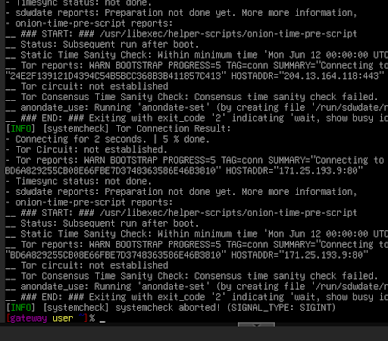
When the machine is trying to connect to tor, press control+c to cancel the script and get a shell.


Edit the network configuration


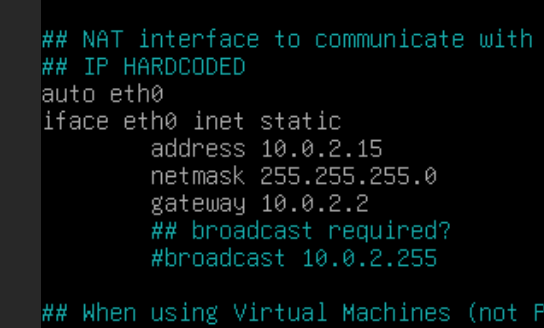
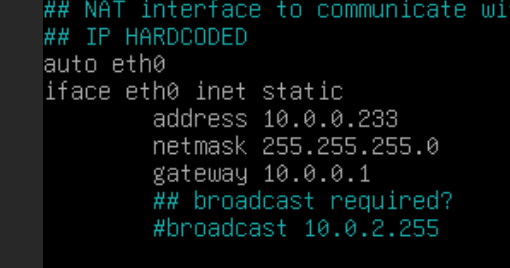
Change the default eth0 configuration to configuration that matches your network. Since Proxmox VM isn't behind NAT, it should be matching the network your proxmox machine is on.

This is default:

This is what I changed the configuration to:

Reboot the VM.

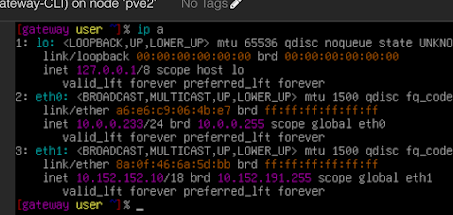
Login and run "ip a" command to ensure that Whonix network has 10.152.152.10 IP and eth0 has an actual IP for your normal network. Check the MAC address to make sure it matches the hardware you have attached.


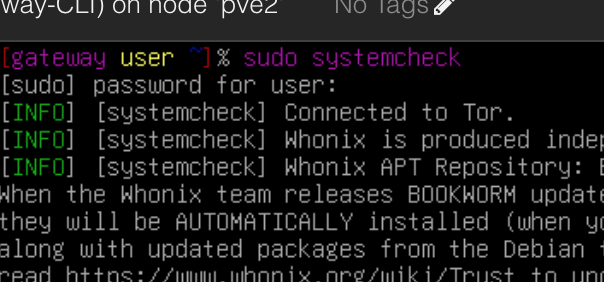
Run "sudo systemcheck" to make sure you're connected to tor.


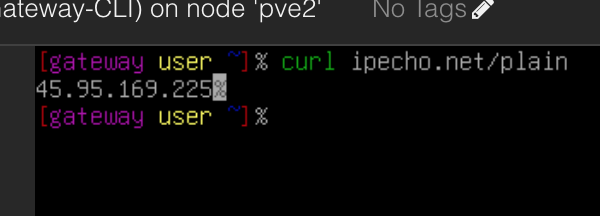
Check your IP and make sure it's not your IP.


Reboot the VM.

Attaching a VM or Container

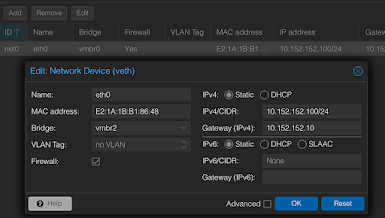
I'm attaching a container to the whonix network but you pretty much do the same with VM but static IP assignment needs to be done inside the VM rather than proxmox webui. Check whonix docs and links below.

I have created an Ubuntu container with the following network settings

Check IP


End

Have fun researching threats & malware!

Links

https://www.whonix.org/

https://www.whonix.org/wiki/VirtualBox#CLI

https://www.whonix.org/wiki/Documentation

https://www.whonix.org/wiki/Other_Operating_Systems

https://malware.news/t/setting-up-whonix-gateway-in-vmware-workstation/61279 

Saturday, October 15, 2022

Looking at process relationships from malware sandbox execution data

Introduction:

This blog post discusses looking at process relationships, specifically from malware sandbox execution data. One of the essential functions of malware sandbox is to gather and display process execution, for example if winword launches powershell, you'd want to know that.

One issue that I run into while doing research is that many of the public/free malware sandboxes don't allow me to search based on process relationships. For example, if I have a sample on an endpoint that executed whoami, nslookup, systeminfo, i would like to be able to search sandbox reports to see which malware families or samples do that.

The other thing I'm interested in as a researcher is trends a long for initial access execution, for specific malware families or in general. One of the twitter accounts I follow is https://twitter.com/pr0xylife and they post information about how malware such as qakbot is doing command/process execution on a system. 

I find the information interesting and obviously, the threat actors have made changes over time. Maybe the threat actors are using new LOLBINs more than before.

The final thing about process relationship data that can be useful is just looking for new things or rare executions. If you're collecting the data, you can do searches to look for rare executions.

All this research should be helpful with detection engineering too or with emulation, if you're trying to match a specific threat.


POC Implementation:

As a proof-of-concept, I decided to implement a searchable database that lets me collect data from malware sandbox report and lets me search for parent-child process relationships. 

I acquired my data from Hybrid-Analysis Public Feed, which gives you JSON file with around 250 recent malware analysis results. I also got data from Zero2Auto CAPE sandbox (https://zero2auto.com/ Thanks for letting me use the data!)


I initially looked at graph databases but asking graph database questions/doing queries seemed annoying to me so I didn't look into them too much.


The second thing I tried was to join data from process execution in Python manually, which was a horrible idea. The code turned out horrible and dataset wasn't fun to work with. (https://github.com/BoredHackerBlog/sandbox_process_relationships/blob/main/hybrid-analysis_public_feed.py)


CAPE and Hybrid-Analysis both record process execution data differently but one thing they have in common is a process list json object. Each process object has process metadata and parent process id and obviously the process id. 

I decided to use duckdb to analyze the data. (Usually I'd use sqlite but wanted to try out duckdb and it worked fine)

I created a table with:

  • report id - specific execution task/detonation in the sandbox
  • process id
  • parent process id
  • process name
  • process path
  • process command line

Then I loaded the results from CAPE or Hybrid-Analysis to the table. I'm loading the same type of data but parsing their json reports is obviously different.

Finally, I created a view with join, where I ensure that report id is the same and parent process id and process id's match.

The resulting view contains:

  • Report ID
  • Parent Process ID
  • Parent Parent Process ID
  • Parent Name
  • Parent Path
  • Parent Command Line
  • Process ID
  • Process Name
  • Process Path
  • Process Command Line

Gathering data from the sandbox reports and putting it in the database allows me to ask questions like these:

  • what process launched ping? select parent_name, proc_commandline from joined_proc_list where proc_commandline ilike '%ping.exe%';
  • what process launched powershell with command line to add Defender exclusion? select parent_name, proc_commandline from joined_proc_list where proc_commandline ilike '%add-mppreference%';
  • what processes launch wscript? select parent_name, count(*) as count from joined_proc_list where proc_commandline ilike '%wscript%' group by parent_name
  • what does cmd.exe launch from the appdata folder? select parent_name, proc_name from joined_proc_list where parent_name ilike '%cmd.exe%' AND proc_path ilike '%appdata%';


The results look kinda like this:


If you have large enough dataset, you can extract more info like malware or campaign name and etc and keep track of the trends.


Other solutions:

If you already are doing malware execution in your sandbox, you can check if you are able to search based on process relationships. 

You could also have a backend database that you can query, for example MongoDB or Elasticsearch, although I personally don't know about join capabilities of those databases.

Alternatively, if your sandbox supports either pushing data out to splunk or elasticsearch or any other place, you could try to work with that data. You can also maybe intercept that data and send it to a webhook or lambda for additional processing.

If you have a system that supports pulling data, maybe through an API, that's also a solution. Maybe have a script that pulls reports, parses data, and processes it.

You can store processed data in whatever database you feel comfortable utilizing. I would personally use Clickhouse or Postgresql if I was doing this. 


Links/Resources:

Code: https://github.com/BoredHackerBlog/sandbox_process_relationships

https://courses.zero2auto.com/

https://www.hybrid-analysis.com/

Also check out Grapl - https://github.com/grapl-security/grapl

Wednesday, July 20, 2022

Screenshotting/scanning domains from certstream with littleshot to find interesting content

Introduction:

Certstream is a great service which provides updates from Certificate Transparency Log, which has info regarding certs being issued from several providers.

Certstream data has been used in the past for detection of malicious sites or phishing sites. There are several links in the resources section about certstream usage.

Littleshot is a tool similar to urlscan and urlquery(RIP) which I wrote a while ago because I wanted to be able to screenshot a ton of sites and collect metadata regarding them. (It's here: https://github.com/BoredHackerBlog/littleshot) I realized having yara scan html body would be cool so I added that feature as well later on. There is also a branch that uses tor for connections. It's not the most optimized project and error handling isn't the best but it's good enough for my purposes.

You can also put newly registered domains through littleshot as well but I've decided not to do that for now.

Goals:

- Take certstream domains and scan them with littleshot

- Utilize yara rules to look for interesting pages

- Send some metadata to Humio (littleshot by default doesn't do this) for either alerting, dashboarding, or just searching.

- Ensure that there is caching of domains from certstream to avoid rescanning domains

Tech stack:

I'm hosting everything on vultr. (Here's a ref link if you'd like to try vultr for your projects: https://www.vultr.com/?ref=8969054-8H)

- Littleshot

-- caddy - reverse proxy

-- flask - webapp

-- redis - job queue

-- python-rq - job distribution/workers

-- mongodb - store json documents/metadata

-- minio - store screenshots

- Certstream + python - Im getting certstream domains and doing filtering and cache lookup with python

- Memcached - Caching. I wanna avoid scanning the same domain twice for a while so i'm using memcached

Setup:

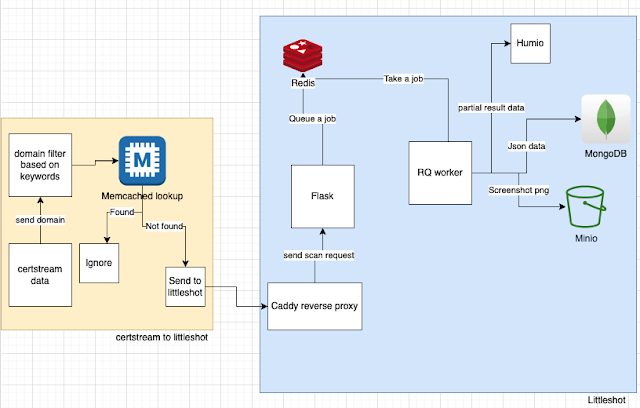
The diagram below shows the setup I have going.


I get data from certstream and I'm using some filtering to ensure that I don't scan certain domains.

Once the keyword based filtering is done, I check the domain against memcached to ensure that it hasn't been scanned before in the past 48 hours.

If the domain wasnt scanned in the past 48 hours, I queue to be scanned with littleshot.

When littleshot worker does the scan, it sends taskid, domain, title, and yara matches to Humio (besides just doing normal littleshot things).

Certstream_to_littleshot script - https://github.com/BoredHackerBlog/certstream_to_littleshot/blob/main/certstream_to_littleshot.py

Yara rules (these aren't the best. you should probably write your own based on your needs) - https://github.com/BoredHackerBlog/certstream_to_littleshot/blob/main/rules.yar

Worker code to support sending data to Humio - https://github.com/BoredHackerBlog/certstream_to_littleshot/blob/main/worker.py


Interesting stuff I came across:

- Lots of wordpress and nextcloud/owncloud sites and general stuff people self-host
- Carding forum?

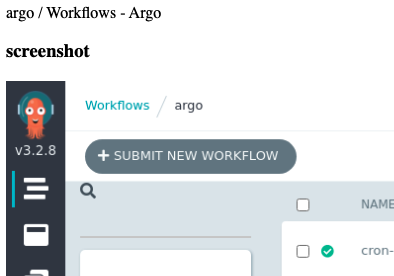
- Argo CI/CD without auth?
- Piracy site


No phishing sites or C2 with at least my yara rules.

Here are the yara hits in Humio (ignore abc,xyz, that was me testing Humio API):


What I would do differently with more time and resources (with this project and with littleshot):

- Better error handling - Current error handling is meh
- Get rid of mongodb and replace it with opensearch or graylog maybe? - Opensearch and graylog are great when it comes to searching.
- Potentially having a indicator list built into littleshot?
-- Currently tagging is based on yara rules but there are many ways to detect maliciousness, such as hash or URLs.
- Enrichment of data like urlscan does
- Better webui - the webui is pretty shit. idk enough html/css/javascript
- Better logging. There is logging of results but no logging of anything else (queries, crashes, etc...)
- Redirect detection & tagging. Some domains do redirect to legitimate login pages.


Resources & similar projects:

https://github.com/ninoseki/uzen - ninoseki github has really cool projects. This one is very similar to littleshot actually.
https://github.com/InfosecExtra/StreamshotY - littleshot fork that someone hooked up with certstream. It has a refreshing page of screenshots too like urlscan.


(if the blog post formatting looks odd, it's because Blogger editor interface hates me)

Wednesday, July 13, 2022

Building a honeypot network with inetsim, suricata, vector.dev, and appsmith

I wanted to learn a bit more about data engineering, databases, app building, managing systems, and so on so I decided to work on a small honeypot network as a project. I was partially inspired by Greynoise and AbuseIPDB, I use both of those a lot. I wanted to get this project done in about a week so this is a small project which isn't too scalable. I ended up learning things so it's fine.

My goals:

- Use Suricata to see what type of signatures are triggered based on the incoming traffic from the internet
- Save all the Suricata logs to disk in a central place so I can go back and search all the data or reingest the data.
- Send logs to Humio for searching, dashboarding, and potentially alerting purposes
- Have a webapp for searching for an IP
-- Webapp should show the signatures the IP has triggered, first time the IP was seen, last time the IP was seen, and number of times it was seen triggering signatures.

My tech stack:

- Sensors & databases are hosted on Vultr w/ Ubuntu
- Obviously Suricata for detecting attack attempt type
- Inetsim - this is not the best (i'm letting the attackers know I'm not running any real services, it's just inetsim, assuming attackers manually go look at the scan results) but it'll do for this project
- Zerotier - all sensors are connected to a zerotier network, it just makes networking, moving data around, and management easier
- Vector.dev - I'm using vector.dev to move data around
- Humio - it's for log storage and search, just like ELK or Splunk
- rinetd - I'm actually not running inetsim on all the sensors, I'm just forwarding all the traffic from sensors to one host running inetsim (it's good enough for this project)
- Redis - pubsub. I'm putting alerts into redis and letting python grab them and put the data in postgresql
- Postgresql - to store malicious IP, signature, and timestamp
- Appsmith - to make webui app (usually i'd use flask...)

Networking:

Network kinda looks like this w/ Zerotier:

Sensors are exposed to the internet, servers aren't. rinetd takes in sensor traffic from the internet and forwards it to inetsim. inetsim is bound to zerotier IP address.


Logging:

The flow for logs kinda looks like this:

Vector on all the sensors reads eve.json, sends the data to vector on the ingest server.
Vector on the ingest server does multiple things. It'll save data to disk, send the data to humio, the alerts will get geoip info added, then it'll go to redis, python will ingest data from redis then put it into postgres.

postgres stores malicious IP, suricata signature, and timestamp.


Python script being used to process redis data and add data to postgres: https://github.com/BoredHackerBlog/dumbhoneypot/blob/main/process_redis.py


Webapp

I used AppSmith for the webapp. AppSmith allows you to build a webapp and connect it to integrations it supports with little to no coding. 

For webapp, I just have an input field and some queries running based on the input. It looks like this:


What would I do different if I had more time and resources:
- I'd probably setup a more realistic honeypots or have honeypot profiles
- Put honeypot software on the sensor itself instead of doing rinetd
- Ship logs through the internet (not zerotier)
- Do geoip enrichment on the sensor itself
- Store alert data in opensearch or some cloud hosted database that I don't have to maintain?
- Add health monitoring for sensor, pipeline, etc..
- Better deployment and update (of software and suricata signatures) potentially through ansible?

There are probably many other things that can be done differently or more efficiently.


Resources/links:

Sunday, December 12, 2021

notes/links about log collection, storage, and searching

Introduction

Just some notes about log collection, storage, and searching.

I just want to be able to store some log data for a long time and do searches on it later in the future, once in a while. I'm not trying to produce a report with the data or do alerting or transport the logs securely.

One of my use cases is collecting network data and storing that for a long time and maybe searching for a specific domain or IP in the future that could've been related to a security incident. 

Similar for incoming http traffic. I'd like to see if someone tried to access a specific URI a really long time ago. (maybe when vuln related to that URI wasn't public at the time)

(leaving out elasticsearch-based things, splunk, and cloud-based services)

notes/links should help w/ research if anyone else is trying to do the same thing as me


Gathering & shipping logs:

For Windows Event Logs:

- fluentbit - https://docs.fluentbit.io/manual/pipeline/inputs/windows-event-log

- fluentd - https://docs.fluentd.org/input/windows_eventlog

- nxlog - https://nxlog.co/docs/nxlog-ce/nxlog-reference-manual.html#im_msvistalog

- winlogbeat - https://www.elastic.co/downloads/beats/winlogbeat-oss

- promtail - https://grafana.com/docs/loki/latest/clients/promtail/scraping/#windows-event-log


- Windows event forwarding - https://docs.microsoft.com/en-us/windows/security/threat-protection/use-windows-event-forwarding-to-assist-in-intrusion-detection WEF sends logs from all the hosts to one collector host

For other text file based logs (linux, webapp, etc..)

- all the tools above

- vector - https://vector.dev/components/

- filebeat - https://www.elastic.co/downloads/beats/filebeat-oss

- rsyslog - https://www.rsyslog.com/

- syslog-ng - https://www.syslog-ng.com/products/open-source-log-management/

- logstash - https://www.elastic.co/downloads/logstash-oss


some of the tools listed above can take in forwarded events (syslog, logtash/beats, etc) from other products and tools as well. 


- kafka - https://kafka.apache.org/ another option for just getting logs from various sources and forwarding them to some other place


input/output, sources/sinks:

- kafka - https://cwiki.apache.org/confluence/display/KAFKA/Ecosystem

- vector - https://vector.dev/components/

- fluentbit - https://docs.fluentbit.io/manual/pipeline/inputs 

https://docs.fluentbit.io/manual/pipeline/outputs

- fluentd - https://docs.fluentd.org/input

https://docs.fluentd.org/output

- logstash - https://www.elastic.co/guide/en/logstash/current/input-plugins.html

https://www.elastic.co/guide/en/logstash/current/output-plugins.html

- rsyslog - https://www.rsyslog.com/plugins/


Log processing:

You may want to process the data to drop certain events or append data to some events. For example, for network data, you may want to use a filter that adds geoip info. You may also want to rename fields.

Many of the collectors and shippers listed above already have some ability to modify or parse the log data. 

Some of the tools are calling these plugins/modules filter or processing or transformer. You may also be able to write your own plugins or some code (some tools above support Lua) to change the logs before output part happens.

Depending on the type of processing you may want to do, you may need to output the logs into a different format that your application understands then process it and put it back into the pipeline for the next step or storage.

For kafka, I found faust (https://faust.readthedocs.io/en/latest/) but there are other libraries too for python and other langs.


Log storage:

The output part in almost all the tools listed above can send data to various places where logs can be index and/or stored. 

You can always store logs to disk on one host w/ compression (obviously searching this is not very fun). Files can also be stored in the cloud. Everything pretty much has s3 output support.

For files stored on disk, many of the tools will allow you to select format such as text, json, etc..

Tools such as logrotate can be used to move, compress, or delete the logs (https://linux.die.net/man/8/logrotate)

cron job/scheduled tasks and some scripts can always be used to move, compress, or delete files as well. 

For being able to easily store and search logs, there is Grafana Loki - https://www.boredhackerblog.info/2021/11/collecting-unifi-logs-with-vector-and.html

Grafana Loki is somewhat similar to elasticsearch or splunk and you can use Grafana webui to query the data.

While doing more research, I came across clickhouse (which is also supported by some of the tools above) (https://clickhouse.com/) Clickhouse can store json data and you can do sql queries on that data. 

I also came across cloki, which is using clickhouse but emulating loki (https://github.com/lmangani/cloki)

The backend is a clickhouse database and you push logs into loki emulator, just like you'd push logs into loki. cloki also supports the same query language as loki and will work with grafana loki connector.


Log search:

Searching the logs depends on how they're stored obviously. For uncompressed or compressed logs, tools such as grep or zgrep or ripgrep (https://github.com/BurntSushi/ripgrep) can be used for searching.

On Windows, there are a few tools that can be used to search and/or query logs. Fileseek (https://www.fileseek.ca/) can be used to search a bunch of files. There is Logfusion (https://www.logfusion.ca/) as well which can be used to read log files.

There is also Log Parser Lizard (https://lizard-labs.com/log_parser_lizard.aspx) which can be used to query log files and even save queries and produce charts or reports.

Files can also be loaded into python w/ pandas for searches, complex searches, or statistical analysis. Pandas supports loading various file types. (https://pandas.pydata.org/docs/reference/io.html)

Finally, if you end up using loki or cloki, grafana can be used to do queries. Grafana also has connectors/plugins for other database/log storage systems. 


Sample logs:

To play with any of the tools above without making changes in production env, you can use sample logs or data sources.

https://github.com/logpai/loghub - github repo that links to several sample logs

https://www.secrepo.com/ - logs related to security. there are some network traffic logs in there

https://www.sec.gov/dera/data/edgar-log-file-data-set.html - EDGAR log files

https://log-sharing.dreamhosters.com/ - various log files

https://www.logs.to/ - log generator (various types)

https://github.com/mingrammer/flog - log generator

https://certstream.calidog.io/ - certificate transparency logs

http://www.hivemq.com/demos/websocket-client/ / broker.mqttdashboard.com - If you want to grab MQTT demo data. I'm pretty sure people are using this for free for their projects too...


ps: i'm not an engineer or an observability expert. Implementation of various tools above varies and may have impact on resource usage.